


Audit how planning actually works in a mid-sized manufacturer running SAP and the same spreadsheet turns up almost every time. It isn’t there because nobody knows SAP. It’s there because the standard makes it hard to compare methods and awkward to keep the plan where it belongs. This article is about closing that gap without buying SAP IBP.
Demand forecasting in SAP: the short answer
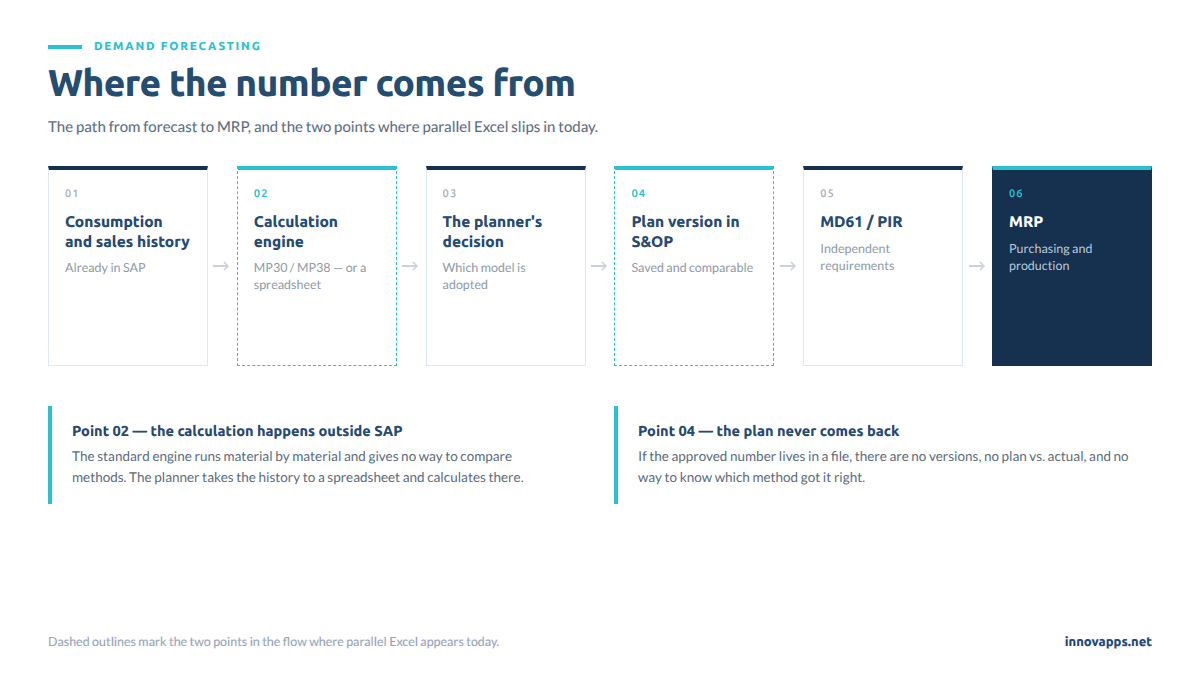
Yes, you can do demand forecasting in SAP without buying SAP IBP. SAP ECC and S/4HANA ship consumption-based forecasting (transactions MP30, MP38, MP31, MP33, with the model set in the Forecasting view of the material master) and S&OP planning to save and compare plan versions. The limit isn’t a missing calculation engine: it’s that the engine works material by material, with little comparative visibility and no screen where a planner can see several models side by side and decide. That gap is what Excel fills today.
One figure to size up why it matters: in industrial and B2B manufacturing, typical SKU-level forecast error runs between 20% and 40% MAPE —Mean Absolute Percentage Error, the average percentage gap between what you forecast and what actually happened— and each additional month of horizon usually adds 2–5 points of error (Umbrex).
1. The uncomfortable diagnosis: your planner doesn’t use Excel out of laziness
Audit the real planning process in a mid-sized company running SAP and the finding is usually the same. There’s a file. It has a tab per product family, last year’s sales, a growth percentage negotiated in a meeting, and manual adjustments only the person who made them understands. And it works just well enough that nobody questions it.
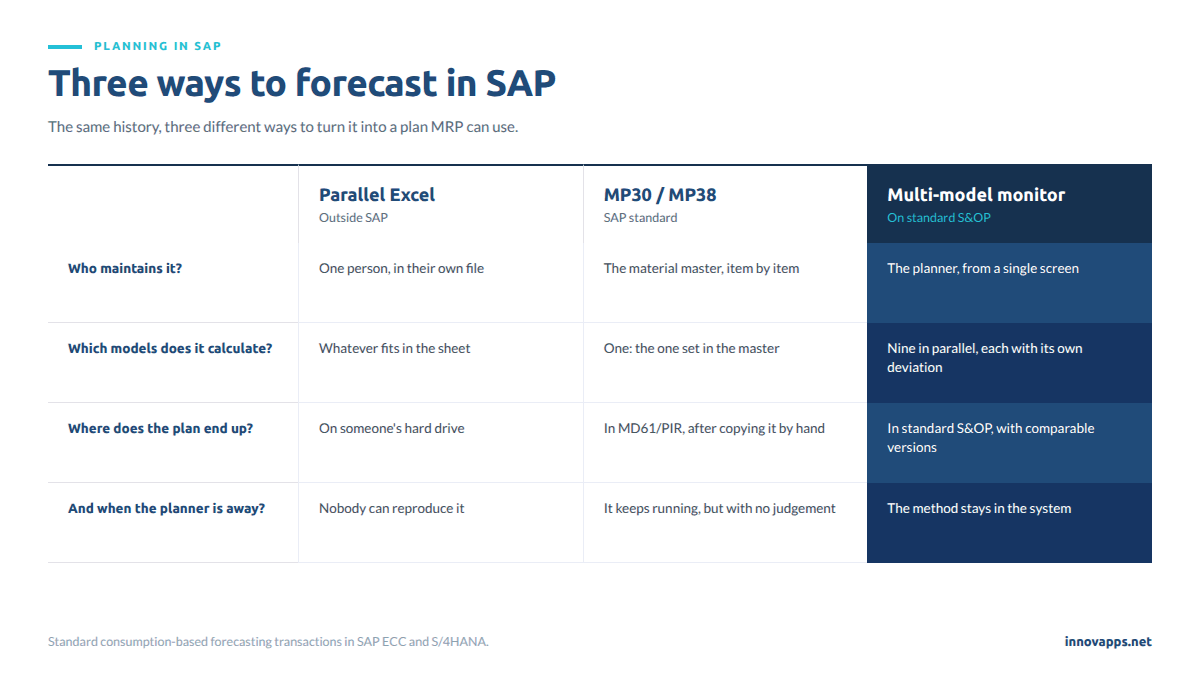
That file doesn’t exist because the planner doesn’t know SAP. It exists because in Excel they can do three things the standard makes hard: see several years of history at once, try more than one calculation method and change their mind without raising a development request. It’s a pattern that repeats across mid-sized industrial companies with SAP in production, whatever the country or the sector.
The problem with parallel Excel isn’t the spreadsheet. It’s that the plan doesn’t stay in the system: no comparable versions, no auditable plan vs. actual, no way to know which method got last quarter right, and all the knowledge living in one person. It’s the same pattern we described when planning the next campaign in Excel in agribusiness.
And that person is getting harder to find. Demand for supply chain profiles outstrips supply by 6:1, rising to 9:1 in forecasting roles, and only 8% of companies say they have enough internal talent (Supply & Demand Chain Executive, 2026). A process that depends on a file and on whoever maintains it is an operational risk, not a method.
2. What SAP standard really gives you, and where it gets stuck
Let’s be fair to the standard: SAP does have forecasting. What it has is consumption-based forecasting, material by material, with very little conversation.
What exists:
- MP30 runs the forecast for one material; MP38 runs it in bulk; MP31/MP33 handle maintenance and review.
- The model (constant, trend, seasonal, seasonal with trend, automatic) is set in the Forecasting view of the material master (SAP Community).
- SOP / flexible S&OP lets you save plan versions and compare time series, in both ECC and S/4HANA.
Where it gets stuck, according to what consultants and key users report in the SAP Community:
| Friction | What happens in practice |
|---|---|
| Mandatory run per material | With MRP type VV, total consumption-based forecasting is mandatory and MP30/MP38 must be run at a frequency defined material by material (SAP Community) |
| Rigid rounding | The rounding threshold is fixed at 1 for MP30/MP38/MM02, which distorts low-volume items (SAP Community) |
| Unplanned requirements that aren’t consumed | The UnplRq generated aren’t consumed by sales orders; they have to be copied by hand into MD61/PIR and leave duplicate lines in MD04 (SAP Community) |
| No model comparison | There’s no screen where a planner sees nine methods for the same material and plant and picks one on the evidence |
And there’s a strategic direction worth putting on the table: SAP states that SOP and flexible S&OP are not strategic tools for S/4HANA and that their intended successor is SAP IBP (SAP Learning). That doesn’t mean they stop working today; it means SAP’s roadmap for advanced planning points at a different product.
3. Before you change anything: find out whether your forecast error is normal
This is the section that decides which problem you actually have, and therefore what to do next. Without a baseline, any discussion about tools is a discussion about opinions.
The reasoning is simple. Calculate your real error over the last closed months and compare it with the typical band for your sector:
- If you’re inside the band, your problem isn’t the calculation: it’s the process. The number is fine, but it lives in a file, has no versions and depends on one person. What you need is to get it into SAP, not a better statistical engine.
- If you’re well above the band, you do have a method problem. And the cheapest way out isn’t buying a more expensive engine: it’s running several models against your own history and keeping the one that deviates least — exactly the approach in section 6.
That’s why the sector benchmark matters: a forecast with 30% error is neither good nor bad in the abstract. In apparel it would be excellent; in stable FMCG, a serious problem.
| Sector / demand type | Typical MAPE | Source |
|---|---|---|
| FMCG / stable-demand staples (A/X SKUs) | 10–25% (25–35% on promotions) | Umbrex |
| Consumer packaged goods (CPG) | 15–25% acceptable | Imperia SCM |
| Industrial / project-driven B2B | 20–40% at SKU level (better at family level) | Umbrex |
| Fashion / apparel (seasonal, short cycle) | 35–60% | Umbrex |
| Small brands ($5–20M) | 25–35% on core SKUs | Izba |
| Cross-industry benchmark (monthly median) | ~85% accuracy | APQC, via Xorosoft |
Two nuances that separate a planner with judgement from one who just watches a number:
- MAPE punishes intermittent demand unfairly. On low-volume or sporadic items —spare parts, long-tail formats— a small absolute error produces a huge percentage. For those, WAPE (Weighted Absolute Percentage Error, which weights error by volume instead of averaging percentages) or unit-based metrics are more honest.
- Horizon matters as much as method. Each additional month of horizon typically adds 2–5 points of WAPE (Umbrex). Comparing your 1-month error with another company’s 6-month error tells you nothing.
The practical conclusion: measuring deviation per model and per closed month is more useful than chasing an ideal MAPE. What makes money isn’t being right; it’s knowing which of your methods is least wrong for your type of item.
4. What the error costs: the argument management actually understands
“Improve the forecast” is a sentence that doesn’t get budgets approved. The cost of the error does.
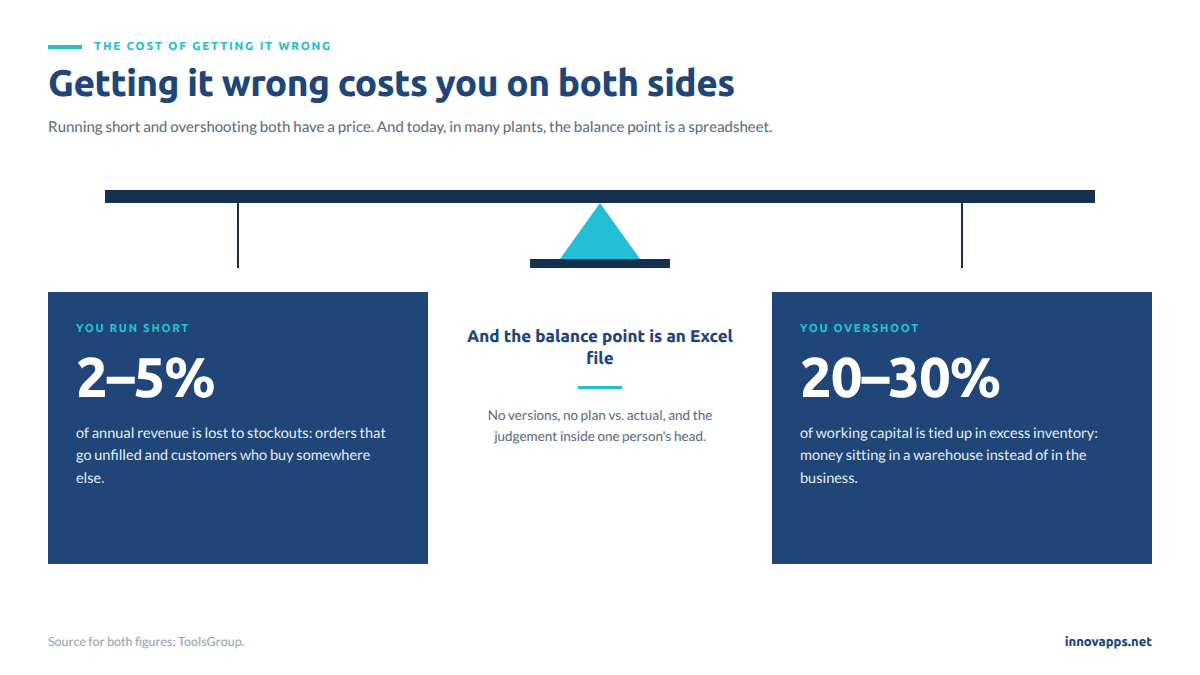
- Stockouts cut annual revenue by 2% to 5%, and excess inventory absorbs 20% to 30% of working capital (ToolsGroup).
- Holding inventory costs 20% to 30% of its value per year (Aislestock).
- For macro context: IHL Group puts global inventory distortion —stockouts plus overstock— at $1.7 trillion in 2026, 6.2% of global retail sales, split 65.6% stockouts and 34.4% overstock (via Xorosoft). It’s a retail figure: use it as the scale of the problem, not as your case.
And on how sensitive the process is: “a relatively small change in forecast error or accuracy has a significant impact on supply cost and efficiency” (Consultoria-SAP). In a food plant with short shelf life, or in pharma with batches, that impact shows up within the same week.
5. SAP IBP: when it makes complete sense and when it’s too much
SAP IBP for demand is a serious product, and for complex supply chains it’s the right answer. The problem is sizing, not quality.
What’s publicly known:
- It’s cloud, billed on cost of goods per year in blocks, and SAP doesn’t publish prices (FitGap; spotsaas).
- Demand Sensing, predictive analytics and network design are separate add-ons; some buyers report “discovering significant additional licence costs mid-implementation” (saplicensingexperts).
- In verified reviews, average implementation time is around 7 months and declared ROI around 19 months (G2).
IBP makes sense if: you plan across multiple plants and countries, you need demand sensing with daily signals, you have a dedicated planning team and a multi-year project budget.
It’s probably oversized if: your planning team is one or two people, your decision cycle is weekly, your real pain is “I want to compare methods and keep the plan in SAP”, and you need it solved this quarter rather than next fiscal year.
Between “Excel” and “IBP” there’s a middle step almost nobody describes: calculating several statistical models on the history you already have in SAP, comparing their deviation over closed months, and saving the adopted version in standard S&OP. It isn’t magic. It’s the work the planner already does by hand, done inside the system.
6. The multi-model approach: compare before you adopt
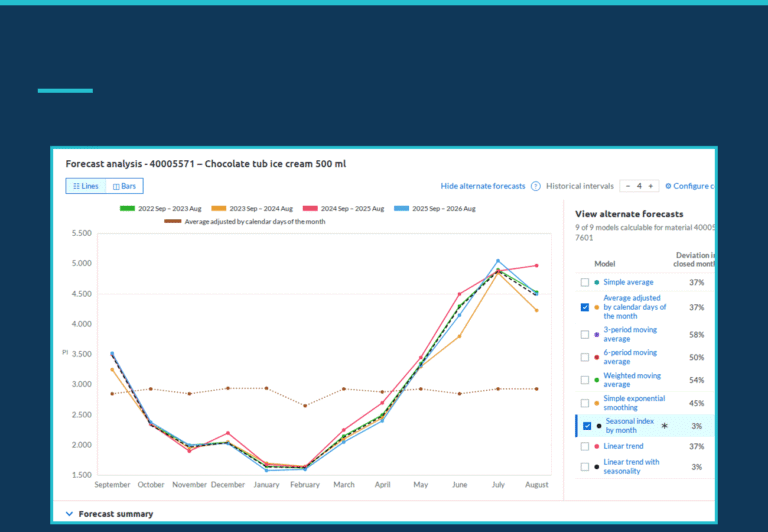
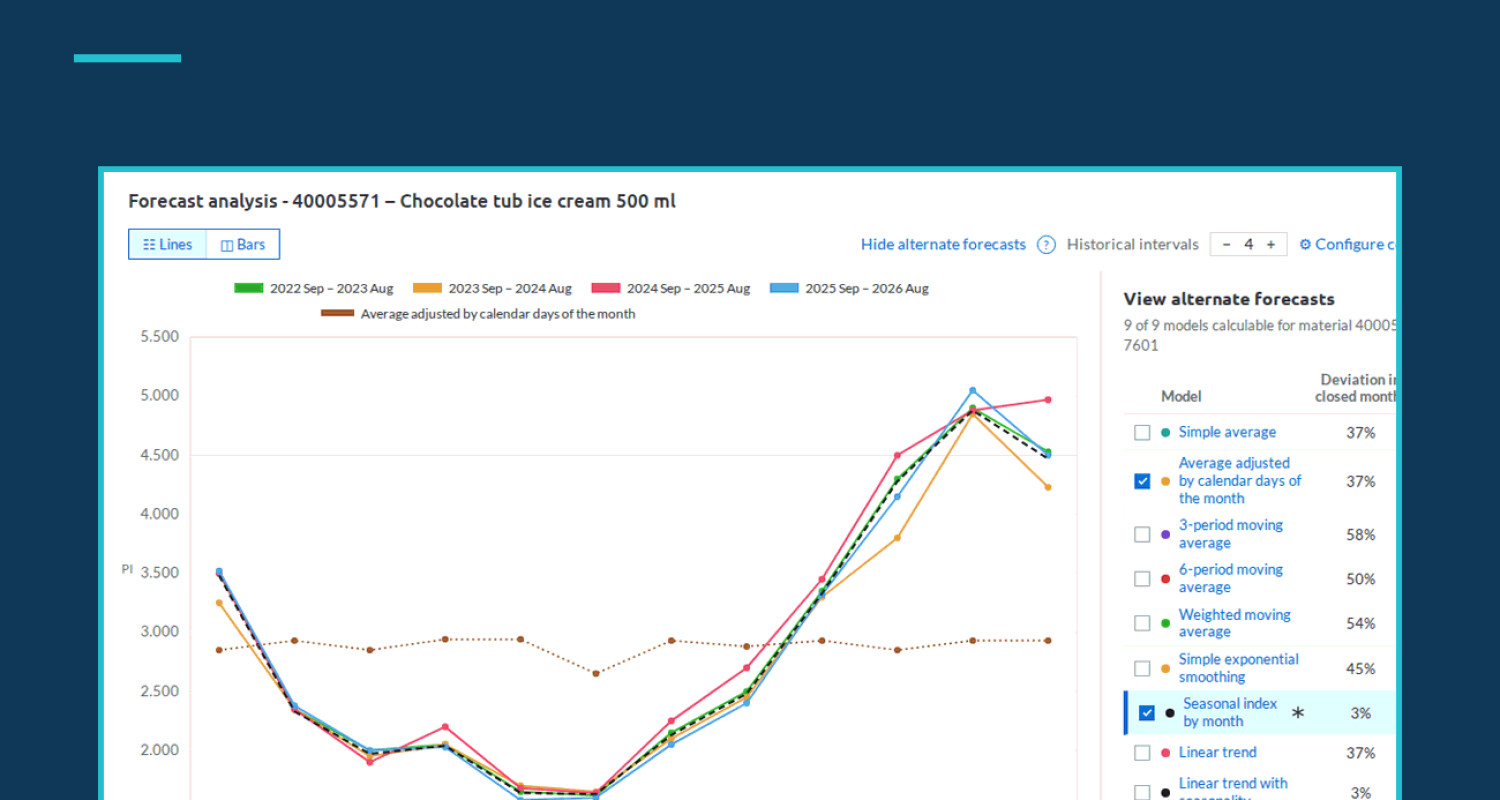
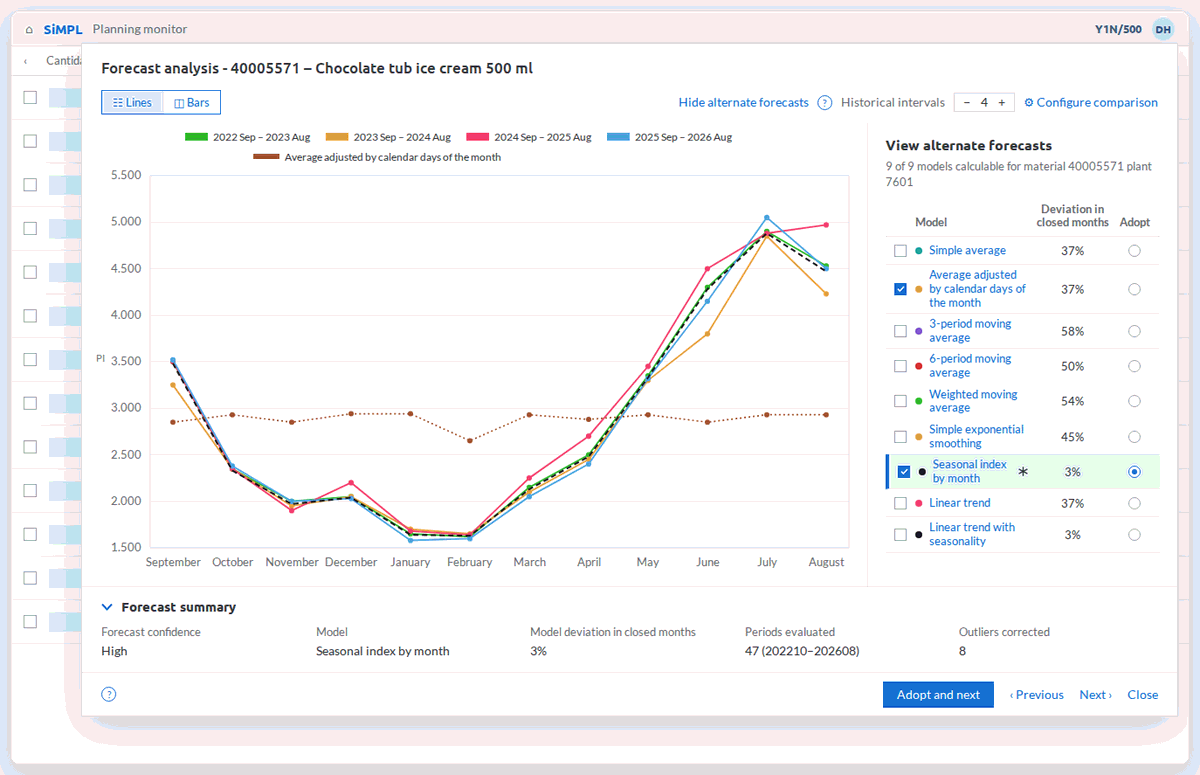
Here’s the change of method, and it’s more process than technology. Instead of configuring one model in the material master and trusting it, several are calculated in parallel for the same material and plant:
- simple average
- average adjusted by calendar days of the month
- 3-period moving average
- 6-period moving average
- weighted moving average
- simple exponential smoothing
- seasonal index by month
- linear trend
- linear trend with seasonality
And each one shows its deviation over the months already closed. With that, the conversation shifts from “how much are we going to sell?” to “which method has been getting this family right?”. The planner compares, adopts the one that performs best, and the decision stays human: nobody lets the system set the plan on its own.
It’s worth being blunt about this, because the market is full of promises of autonomous forecasting: this is not AI that forecasts by itself. It’s multi-model statistical calculation, transparent and auditable, with a human deciding. That it’s less flashy is exactly why it works in a mid-sized company.
The rest is plumbing that matters: overlaying several years of history on one chart with trend and seasonality lines, saving multiple versions of the plan and comparing plan vs. actual by time series, and leaving the result in SAP’s standard S&OP so MRP works from it.
That is, specifically, what SiMPL does — Innova’s planning monitor: it integrates the planning chain (MRP) into one interface where the planner sees the history, compares models by deviation and adopts the one they choose, with the plan saved in SAP’s standard S&OP. It runs on SAP ECC and S/4HANA (all editions except S/4HANA Cloud Public Edition), is implemented in 4–8 weeks and has no cost per user and no cost per company code — which means the planner, the plant manager and the operations director can all look at the same plan without changing the invoice.
No brochure: the part that changes your numbers is the method —compare before you adopt—. The app is how you do it without maintaining a file.
7. How to start without buying anything this week
Measure where you are. Calculate MAPE (and WAPE, for intermittent items) over your last six closed months, at family and at SKU level. Without a baseline, any improvement is an opinion.
Compare against your sector, not against the best case in the world. Use the table in section 3.
Inventory the spreadsheets. How many files there are, who maintains them, what happens if that person is away for two weeks.
Test two or three models by hand on a representative family and see which would have got it right. Done once, that exercise is usually what unblocks the decision — it’s where a real planning case with SiMPL started.
Decide the step. If the answer is “I need to compare models and keep the plan in SAP”, your problem doesn’t require IBP. If it’s “I need multi-country demand sensing with daily signals”, it does.
Frequently asked questions
Can I forecast demand in SAP without buying IBP?
Yes. ECC and S/4HANA include consumption-based forecasting (MP30, MP38, MP31, MP33) and S&OP planning to save plan versions and compare plan vs. actual. What the standard doesn’t offer comfortably is a screen where you compare several models by deviation before adopting one; that gap is filled either by an app on top of the standard or, as today, by Excel.
What MAPE is “good” in my sector?
It depends on how volatile your demand is. In stable FMCG, 10–25%; in consumer packaged goods, 15–25%; in industrial B2B, 20–40% at SKU level; in fashion, 35–60%. And a caveat: MAPE unfairly penalises low-volume or intermittent items, where WAPE is a more honest metric.
What are the limitations of MP30 and MP38?
The three most reported: a mandatory run material by material at a frequency defined in the master; a rounding threshold fixed at 1, which distorts low-volume items; and unplanned requirements that aren’t consumed by sales orders and have to be copied by hand into MD61/PIR, leaving duplicate lines in MD04.
Is the forecast automatic?
No. The approach we argue for is multi-model and statistical: the system calculates several methods in parallel and shows the deviation of each one over the closed months, and the planner decides which model to adopt. The decision is human and is recorded as a plan version in SAP’s standard S&OP.
What if we’re migrating to S/4HANA?
Consumption-based forecasting and S&OP exist in both environments, although SAP has stated that SOP/flexible S&OP are not strategic for S/4HANA and that their intended successor is IBP. A planning monitor that runs on both ECC and S/4HANA lets you solve the process today without constraining tomorrow’s platform decision — the same logic that applies to moving to S/4HANA without dragging the technical debt along.
Want to see nine models compared against your own history? We’ll look at it with your materials, not with sample data.